Part I – Understanding Market Structure
Why Market Structure Matters
Before using indicators, you must understand how the market moves. Market structure is the foundation of technical analysis—it tells you where price is, where it has been, and where it might react.
Every chart, no matter the timeframe, follows a simple rhythm: impulse, correction, continuation, or reversal. Understanding this rhythm helps you identify the context for every trade SkyAnalyst AI analyzes.
What Is Market Structure?
Market structure refers to how price moves in waves—a sequence of highs and lows that form recognizable patterns.
- When each new high is higher than the last, and each low is also higher → Uptrend.
- When each new low is lower than the last, and each high is also lower → Downtrend.
- When highs and lows stay within the same area → Range or Sideways Market.
Identifying structure tells you which group is in control: buyers (bulls), sellers (bears), or neither.
How SkyAnalyst AI Detects Structure
The app reads market structure the same way a CMT-style analyst would. It tracks pivot points—the swing highs and swing lows formed by the market.
- Swing High: A point where price stops rising and starts to fall.
- Swing Low: A point where price stops falling and starts to rise.
By analyzing sequences of these points, SkyAnalyst AI classifies structure as bullish, bearish, or neutral.
| Structure Type | Definition | AI Behavior |
|---|---|---|
| Bullish | Higher highs and higher lows | Focuses on long opportunities |
| Bearish | Lower highs and lower lows | Focuses on short opportunities |
| Neutral / Range | Sideways movement | Waits for breakout confirmation |
This logic ensures the AI never interprets isolated candles—it always understands context first.
Support and Resistance
Support and resistance are zones, not single lines. They represent areas where price reacted before, and where many traders may enter or exit again.
- Support: A price zone where buying pressure was strong enough to stop a fall.
- Resistance: A zone where selling pressure was strong enough to stop a rise.
SkyAnalyst AI builds these zones dynamically using past pivot clusters and volume data. This helps the AI identify reaction levels that have proven meaningful historically.
Example:
- If price rejected a level multiple times, the AI marks it as a significant resistance.
- If the same level holds as support after a breakout, it becomes a support-turned-demand zone.
Fibonacci Retracements
The Fibonacci retracement tool measures how far price pulls back before continuing its trend. SkyAnalyst AI uses Fibonacci levels (especially 38.2%, 50%, and 61.8%) to detect retracement zones—areas where reversals or continuation moves often start.
Example:
- In an uptrend, a pullback to 38.2% or 61.8% can signal a potential continuation.
- In a downtrend, rallies that retrace 50–61.8% often fade back to the main trend.
Fibonacci retracements give traders measured expectations instead of emotional reactions.
| Fibonacci Level | Meaning |
|---|---|
| 23.6% | Shallow retracement, strong trend. |
| 38.2%–50% | Normal correction zone. |
| 61.8% | Deep retracement, potential reversal. |
When combined with structure and volume, Fibonacci levels provide high-probability entry and exit zones.
This chart illustrates a US30 Fibonacci Retracement Entry Strategy, showing how traders identify potential buying opportunities during a market pullback. The price first moves upward (Initial Uptrend), then retraces downward to test key Fibonacci levels—specifically the 61.8% retracement, highlighted as the optimal ENTRY zone. This level often acts as a strong support within a broader uptrend. Once price reacts to this zone and begins to rise again (Continuation Up), traders anticipate a potential continuation of the previous bullish trend toward the prior high or beyond.
Market Phases
Markets don't move randomly; they cycle through four phases repeatedly:
| Phase | Description | Typical Candle Behavior |
|---|---|---|
| Accumulation | Price ranges quietly after a decline | Small bodies, long wicks, mixed direction |
| Advancing (Uptrend) | Price begins forming higher highs | Consecutive bullish candles, rising momentum |
| Distribution | Price ranges after an uptrend | Indecision candles, wicks on both sides |
| Decline (Downtrend) | Price starts forming lower lows | Consecutive bearish candles, increased range |
Recognizing these phases helps you trade with the market instead of against it. SkyAnalyst AI tracks these transitions to identify when the market is shifting from quiet to impulsive behavior.
Candle Interaction with Structure
Candles give life to structure.
At support or resistance, watch how individual candles behave:
- Long wicks → rejection.
- Full bodies → conviction.
- Tiny bodies → indecision.
SkyAnalyst AI reads these reactions automatically, combining them with structure data to confirm strength or weakness at key levels.
Example:
- A bullish engulfing candle at a 61.8% retracement → strong reversal signal.
- A doji or pin bar at resistance with high volume → potential exhaustion.
These reactions are what later sections will teach you to recognize in detail.
Multi-Timeframe Structure
Market structure exists at every level—1 minute, 15 minutes, 1 hour, daily.
Professionals align smaller trends with larger ones to avoid trading against momentum.
SkyAnalyst AI performs this check automatically:
- Higher timeframe (HTF) defines macro bias.
- Lower timeframe (LTF) provides entries and execution logic.
| HTF Bias | LTF Behavior | Signal Strength |
|---|---|---|
| Bullish | Bullish structure | Strong |
| Bearish | Bearish structure | Strong |
| Mixed | Opposite signals | Avoid |
When both timeframes align, candle confirmation carries more weight.
How SkyAnalyst AI Uses Structure
The AI doesn't just draw lines—it quantifies structure:
- Measures swing distances and retracement ratios.
- Detects Fibonacci and pivot alignment.
- Monitors candle behavior at these areas.
- Waits for volume and momentum confirmation before triggering entries.
Structure defines where to look.
Candles define when to act.
Key Lessons from Part I
- Market structure defines trend, range, and reversal.
- Pivot highs/lows and Fibonacci levels help identify reaction zones.
- Support and resistance are zones, not lines.
- Structure is the foundation for every indicator and entry decision.
- SkyAnalyst AI uses structure to establish context before confirming with trend or momentum indicators.
The next part will teach you how candles reveal the true language of price—the when behind every where.
Part II – Price Action & Candle Logic
2.1 Why Candle Behavior Matters
Candles are the purest language of price.
They record the battle between buyers and sellers—every hesitation, rejection, and surge.
Before algorithms and indicators, professional traders read the market by watching how candles formed at key levels.
SkyAnalyst AI still uses this foundation: structure tells you where, but candles tell you when.
Each candle is a message about participation, conviction, and emotion.
Learning to interpret them transforms your analysis from mechanical to intuitive.
2.2 Candle Anatomy
Each candle has four components that reveal how price moved within that period:
| Component | What It Shows | Meaning |
|---|---|---|
| Open | Where price began the session | Starting point of sentiment |
| Close | Where price ended | Who won — buyers (close higher) or sellers (close lower) |
| Body | Distance between open and close | Strength of conviction |
| Wicks (shadows) | Extremes of price during that period | Rejection or overextension |
- A large body = strong conviction.
- A small body with long wicks = hesitation or absorption.
- A full candle (no wicks) = aggressive move.
SkyAnalyst AI quantifies these visually intuitive features.
It assigns numerical values to body-to-wick ratios, detecting momentum, rejection, or indecision automatically.
Anatomy of a Candle
2.3 Context Is Everything
A candle's meaning depends on where it forms:
- A bullish candle at support = potential reversal.
- The same candle at resistance = possible trap.
- A doji in the middle of a range = noise, not signal.
SkyAnalyst AI reads candles in context.
It does not act on isolated patterns—it evaluates their placement within structure, trend, and volume.
2.4 Momentum Candles
Momentum candles represent strong control by one side.
They are large-bodied, often with little to no wick.
| Type | Appearance | Implication |
|---|---|---|
| Bullish Momentum Candle | Large green/white body closing near high | Strong buying pressure; continuation likely |
| Bearish Momentum Candle | Large red/black body closing near low | Strong selling pressure; continuation likely |
SkyAnalyst AI uses these to confirm breakouts or trend accelerations.
If volume confirms and structure supports, these candles trigger "entry readiness" states in the app.
Bullish Momentum Candle
This chart captures a clear example of a bullish momentum candle around 8:30, where price surges sharply in one direction with a large green body and minimal wicks. This type of candle reflects strong buying pressure—buyers taking control decisively, often following news releases, liquidity events, or technical breakouts. The absence of upper shadows shows that buyers maintained dominance throughout the candle's formation, closing near the high.
SkyAnalyst AI classifies such events as momentum signals that confirm breakouts or trend accelerations. When this type of candle forms alongside rising volume and supportive structure, the AI marks it as an "entry readiness" condition—indicating that momentum, structure, and participation are aligned. In short, momentum candles like this represent moments when institutional strength enters the market, signaling that continuation in the same direction is statistically more likely.
2.5 Exhaustion Candles
Exhaustion candles occur when one side pushes too far, and the other side absorbs that pressure.
They show up as long wicks, often at the end of a move.
| Type | Appearance | Meaning |
|---|---|---|
| Hammer / Pin Bar (bottom) | Long lower wick, small body near top | Rejection of lower prices; potential reversal upward |
| Shooting Star (top) | Long upper wick, small body near bottom | Rejection of higher prices; potential reversal downward |
| Doji | Small body, long wicks both sides | Indecision; pause before decision |
SkyAnalyst AI monitors wick ratios and structure location to mark potential exhaustion zones—especially when aligned with Fibonacci levels or volume divergences.
Hammer Exhaustion Example
Hammer Candles - Bullish Exhaustion
In this chart, we see two clear hammer candles forming around 7:00 a.m. and 8:00 a.m., both showing long lower wicks and small bodies near the top. These are classic exhaustion candles, indicating that sellers pushed the price lower, but buyers quickly absorbed the pressure and drove the price back up before the candle closed. This pattern reflects rejection of lower prices and often appears near the end of a short-term downtrend, signaling a potential reversal or shift in momentum.
SkyAnalyst AI identifies these hammer structures by analyzing wick-to-body ratios and their position within market structure. When two consecutive hammers appear like this—especially after a decline—it strengthens the probability of an upward reversal. If this setup aligns with Fibonacci support levels or rising volume, the AI classifies it as an exhaustion zone with bullish confirmation potential, alerting traders to prepare for a possible long entry as momentum shifts upward.
Shooting Star Exhaustion Example
Shooting Star - Bearish Exhaustion
In this chart, we see a clear shooting star candle forming around 13:30, characterized by a long upper wick and a small body near the bottom. This type of candle occurs when buyers push the price sharply higher, but sellers quickly absorb that strength, forcing the price back down before the candle closes. The result is a strong rejection of higher prices, signaling that bullish momentum has weakened and a potential reversal to the downside may follow.
SkyAnalyst AI identifies this pattern as a potential exhaustion signal—especially when it forms after a sustained upward move, as seen here. The system monitors wick length ratios and the candle's position within structure to determine whether the move represents genuine rejection or temporary hesitation. When a shooting star aligns with resistance zones, Fibonacci levels, or divergent momentum readings, SkyAnalyst AI increases its probability weighting for a trend reversal, alerting traders to protect profits or prepare for short opportunities.
Doji Exhaustion Example
Doji - Indecision & Exhaustion
In this chart, we can see a Doji candle forming around 18:00, displaying a very small body with wicks on both ends. This structure indicates a moment of indecision in the market—neither buyers nor sellers managed to take control by the candle's close. After a sharp downward move, this type of candle often signals that selling pressure is being absorbed and that momentum may be stabilizing. The Doji essentially represents a pause before the next directional decision, where traders reassess positioning before the market commits to a new move.
SkyAnalyst AI identifies Doji formations as potential exhaustion markers, especially when they occur after impulsive trends or near Fibonacci support/resistance zones. When paired with declining volume or a loss of momentum in indicators like RSI or MACD, a Doji provides valuable early confirmation that the trend may be losing strength. In such cases, the AI shifts to a neutral bias, waiting for structure and momentum alignment before generating new directional signals.
2.6 Reversal Patterns
Reversal patterns consist of 1–3 candles signaling a potential shift in control.
| Pattern | Description | Interpretation |
|---|---|---|
| Bullish Engulfing | Large bullish candle fully engulfs prior bearish candle | Buyers reclaim control; reversal from support |
| Bearish Engulfing | Large bearish candle engulfs prior bullish candle | Sellers regain control; reversal from resistance |
| Morning Star | Bearish → small indecision → strong bullish candle | Reversal pattern from downtrend to uptrend |
| Evening Star | Bullish → small indecision → strong bearish candle | Reversal pattern from uptrend to downtrend |
| Tweezer Bottom/Top | Two opposite candles rejecting the same price level | Double rejection — strong sign of exhaustion |
SkyAnalyst AI recognizes these patterns numerically, combining them with momentum and structure data before confirming reversals.
Engulfing Patterns Example
Bearish & Bullish Engulfing Patterns
In this chart, we observe a bearish engulfing candle forming around 1:15, followed by bullish engulfing patterns at 2:15 and again near 4:00. The bearish engulfing marks a clear reversal from resistance, where sellers regain control—its large red body completely overtakes the previous green candle, signaling a shift from buying pressure to selling dominance. Shortly after, buyers respond with a bullish engulfing at 2:15, reclaiming control as a large green candle fully engulfs the prior red one. This action often reflects absorption of selling pressure and the emergence of renewed demand near a structural or psychological support level.
The second bullish engulfing pattern around 4:00 reinforces this reversal and confirms the transition from a bearish phase to an early uptrend. SkyAnalyst AI evaluates these formations numerically, comparing candle body size, wick ratios, and their position within market structure. When multiple engulfing patterns align—especially near key support or resistance zones—the AI raises the probability of a confirmed reversal, signaling that market control has shifted decisively from one side to the other.
Evening Star Pattern Example
Evening Star - Trend Reversal
In this chart, we can clearly see an Evening Star pattern forming around 3:45, marking a potential reversal from an uptrend to a downtrend. The sequence begins with a strong bullish candle showing upward momentum, followed by a small-bodied candle that reflects indecision—buyers start losing conviction while sellers begin to appear. The third candle, a large bearish one, confirms the shift in control as it closes deep into the body of the first bullish candle. This combination signals that the previous buying pressure has been exhausted and sellers have taken command, often leading to a short-term or structural correction.
SkyAnalyst AI detects this pattern by analyzing candle relationships, wick ratios, and momentum context. When the system identifies an Evening Star near resistance or Fibonacci retracement zones, and momentum indicators like MACD or RSI show divergence, it flags the setup as a confirmed exhaustion-reversal event. This allows the model to anticipate a potential top formation and prepare for a directional shift—aligning with CMT principles of recognizing early weakness after parabolic moves.
Morning Star Pattern Example
Morning Star - Bullish Reversal
In the chart above, the Morning Star pattern appears around 21:00 — a textbook three-candle reversal formation. It starts with a strong bearish candle, followed by a small indecisive one (often a doji or spinning top), and concludes with a large bullish candle that closes deep into the first candle's body. This transition visually marks a shift from selling pressure to buying strength. SkyAnalyst AI identifies such formations by combining candle behavior with momentum and structural context, confirming when a true reversal is likely in progress.
Tweezer Top Pattern Example
Tweezer Top - Double Rejection
In the chart above, a Tweezer Top pattern forms around 14:00 — a classic double rejection signal often found near resistance zones. This pattern occurs when two consecutive candles test the same high level but fail to break higher, showing that buyers lost momentum and sellers are stepping in. The second candle, typically bearish, confirms the rejection and potential reversal. SkyAnalyst AI identifies these setups through numerical analysis of candle symmetry, volatility, and structural alignment to detect exhaustion and confirm when a shift from buying to selling pressure is likely underway.
2.7 Continuation Patterns
Continuation candles appear within a trend, showing brief pauses before momentum resumes.
| Pattern | Description | Meaning |
|---|---|---|
| Marubozu | Full-body candle, no wicks | Pure trend conviction; continuation likely |
| Three White Soldiers | Three strong bullish candles after a decline | Strong bullish continuation |
| Three Black Crows | Three strong bearish candles after a rise | Strong bearish continuation |
| Breakout Bar | Large candle closing beyond structure with volume | Trend resumption confirmation |
When SkyAnalyst AI detects continuation patterns aligned with EMAs and MACD slope, it classifies them as momentum entries.
Marubozu Pattern Example
Marubozu - Pure Conviction
In the chart above, a Marubozu candle appears around 5:45 — a full-bodied candle with no wicks, representing pure market conviction. The absence of shadows indicates that price opened at one extreme and closed at the other, with complete dominance by one side of the market. In this case, the strong bearish Marubozu confirms that sellers were fully in control, continuing the prevailing downtrend with strong momentum. SkyAnalyst AI identifies Marubozu candles as high-confidence continuation signals, especially when aligned with EMA direction and MACD slope, confirming momentum-based entries.
Three White Soldiers Pattern Example
Three White Soldiers - Bullish Continuation
In the chart above, the Three White Soldiers pattern emerges starting around 8:30 — a strong bullish continuation signal following a prior downtrend. It consists of three consecutive long-bodied bullish candles, each opening within the previous candle's body and closing progressively higher. This steady sequence reflects sustained buying pressure and renewed confidence from market participants. SkyAnalyst AI detects this formation when momentum, EMA alignment, and MACD slope confirm that the upward move has structural and directional strength, classifying it as a momentum entry setup.
Three Black Crows Pattern Example
Three Black Crows - Bearish Continuation
In the chart above, the Three Black Crows pattern begins forming around 15:15 — a powerful bearish continuation signal following an upward move. It is composed of three consecutive long-bodied bearish candles, each opening within the previous candle's body and closing lower, showing consistent selling pressure. This pattern reflects a decisive shift in sentiment as sellers take control and momentum accelerates downward. SkyAnalyst AI identifies Three Black Crows when EMA alignment and MACD slope confirm downside continuation, signaling high-confidence momentum entries in the direction of the prevailing trend.
2.8 Candle Sequences and Price Action Logic
Candle patterns rarely act alone.
SkyAnalyst AI reads sequences of 2–5 candles to interpret evolving sentiment.
Example of bullish sequence:
- Long bearish candle into support (selling climax)
- Hammer rejecting lower prices (absorption)
- Bullish engulfing candle (shift of control)
That 3-candle sequence is stronger than any single pattern.
The AI reads this sequence mathematically—combining body ratios, momentum slope, and volume delta to flag transition setups.
2.9 Candle + Structure Integration
Price action gains meaning only when connected to structure.
| Structure Zone | Candle Behavior | Interpretation |
|---|---|---|
| Support + Hammer | Buyer absorption | Potential reversal |
| Resistance + Shooting Star | Seller absorption | Rejection signal |
| Fibonacci 50% + Engulfing | Reaction zone | Continuation or reversal depending on trend |
| Breakout above Resistance + High-Volume Marubozu | Trend expansion | Continuation entry zone |
SkyAnalyst AI labels these as "entry triggers", connecting candle analysis directly to trend, momentum, and volume layers.
2.10 The Role of Candles in SkyAnalyst AI Logic
SkyAnalyst AI does not simply detect patterns—it scores them based on:
- Context (location in structure)
- Strength (body vs wick ratio)
- Confirmation (volume and momentum alignment)
- Continuity (does the next candle confirm?)
Each score helps determine if a signal becomes:
- Observation (possible setup forming)
- Trigger (entry-level condition met)
- Invalidation (pattern fails confirmation)
This system keeps entries objective, structured, and repeatable.
2.11 Key Lessons from Part II
- Candles are the language of price; learn to read them in context.
- Large bodies show conviction; long wicks show rejection.
- Reversal patterns (hammer, engulfing, stars) appear near key zones.
- Continuation patterns (Marubozu, soldiers, breakout bars) confirm trend strength.
- SkyAnalyst AI analyzes candle structure numerically, integrating it with trend, momentum, and volume to produce objective entry logic.
The next part will explain Trend and Directional Bias—how to align your candle-based signals with market direction using EMAs and multi-timeframe confirmation.
Part III – Trend and Directional Bias
Why Trend Comes Before Everything
Before thinking about entries or indicators, you must know which direction the market is moving. Trading against the dominant trend is like swimming against a current—you might make progress, but you'll tire quickly and lose momentum.
Professional traders and analysts always start with a single question: Is the market trending up, trending down, or moving sideways?
SkyAnalyst AI uses the same logic. Every signal it generates is filtered through its internal trend model before anything else.
How SkyAnalyst AI Defines Trend
SkyAnalyst AI uses two exponential moving averages (EMAs) to define trend:
- Fast EMA (20) – responds quickly to price.
- Slow EMA (50) – smooths short-term noise.
When the 20 EMA crosses above the 50 EMA, the system recognizes a bullish trend. When the 20 EMA crosses below the 50 EMA, it identifies a bearish trend.
| EMA Relationship | Trend Type | AI Focus |
|---|---|---|
| 20 above 50 | Bullish | Looks for long opportunities |
| 20 below 50 | Bearish | Looks for short opportunities |
| 20 and 50 close or flat | Neutral | Waits for direction confirmation |
This crossover method aligns perfectly with CMT trend-following principles—it keeps traders focused on direction, not prediction.
EMA 20/50 Crossover
The blue line represents the 20-period Exponential Moving Average (EMA), which reacts quickly to recent price changes and helps identify short-term momentum. The yellow line is the 50-period EMA, a slower trend indicator that smooths out price action to show the broader direction. When the 20 EMA is above the 50 EMA, as shown here, it signals a bullish bias—suggesting that buyers are in control and the trend remains upward.
The Role of Slope and Angle
The strength of a trend is not just in the crossover—it's also in the slope of the EMAs.
- A steep angle indicates strong momentum.
- A flat or converging slope shows weakening direction.
SkyAnalyst AI reads the slope numerically. A strong positive slope confirms continuation; a flat slope signals possible consolidation or reversal.
You can visualize it easily:
- Rising, wide EMAs → trending.
- Flat, tangled EMAs → range.
Never trade strong conviction signals when EMAs are tangled. That's the market's way of saying: "no clear direction."
Multiple Timeframe Alignment
Trends exist on all timeframes. A 5-minute uptrend might be a small pullback inside a 1-hour downtrend. That's why professionals always look for trend alignment across multiple charts.
SkyAnalyst AI follows the same rule:
- Higher timeframe (e.g., 1H) defines the main bias.
- Lower timeframe (e.g., 15M, 5M) provides entry precision.
| Scenario | Interpretation |
|---|---|
| Higher and lower both bullish | Strong trend confluence. Priority = long. |
| Higher bullish, lower neutral | Early stage continuation possible. Wait for confirmation. |
| Higher bearish, lower bullish | Countertrend move. High risk. |
Multi-timeframe logic prevents traders from taking setups against the dominant flow.
3.4 Candles as Trend Confirmations
Candles help confirm whether the trend has strength or weakness:
| Candle Behavior | Trend Context | Interpretation |
|---|---|---|
| Consecutive large bullish bodies closing near highs | Uptrend | Momentum continuation |
| Small-bodied candles with upper wicks | Uptrend | Buyer fatigue, possible pullback |
| Consecutive bearish candles closing near lows | Downtrend | Momentum continuation |
| Long lower wicks during downtrend | Downtrend | Seller fatigue, possible bounce |
SkyAnalyst AI monitors these visual cues algorithmically. If candles start showing hesitation or absorption, it flags "trend weakening" even before indicators catch up.
The AI also evaluates slope, spacing, and behavior of the EMAs to determine trend strength:
- Wide spacing + steep slope = strong, healthy trend
- Flat or converging EMAs = weakening or consolidating trend
The AI cross-references EMA behavior with momentum candles, MACD, and volume:
- If EMAs are bullish and large-bodied bullish candles appear with rising volume → trend confirmation
- If EMAs flatten and exhaustion candles (doji, pin bars) form → trend fatigue alert
Recognizing Trend Transitions
Every trend eventually ends. Recognizing early warning signs helps you adjust risk and expectations.
Common reversal clues:
- EMAs flatten and start to converge.
- Price forms lower highs in an uptrend or higher lows in a downtrend.
- Momentum indicators diverge (price makes new highs, MACD or RSI does not).
- Volume drops sharply while price continues rising or falling.
SkyAnalyst AI detects these conditions as trend exhaustion signals and shifts to neutral bias until confirmation appears.
The Discipline of Trend Trading
The hardest part of trading with the trend is patience. Many traders exit too soon or fade a move before it's finished. Trend trading requires accepting that you will never catch the exact top or bottom—you ride the middle of the move.
Professionals say: "The middle is where the money is." SkyAnalyst AI uses this principle by waiting for structure and confirmation before signaling any reversal.
3.7 Trend + Candle Integration Example
Example 1: High Confluence Setup
- EMAs: 20 > 50 → bullish trend
- Structure: price retracing to 50% Fibonacci level
- Candle: bullish engulfing bar at retracement zone
- Volume: above average
→ SkyAnalyst AI marks this as a bullish continuation setup with "high confluence."
Example 2: Low-Quality Countertrend
- EMAs: 20 < 50 → bearish
- Candle: bullish engulfing off support but with low volume
→ Low-quality countertrend move. AI marks it as "observation only."
3.8 Common Mistakes When Reading Trend
| Mistake | Why It's a Problem | Correction |
|---|---|---|
| Trading against the EMAs | Fighting the dominant flow | Align direction before entry |
| Ignoring candle behavior | Missing weakening signs | Watch wicks and body size |
| Entering before confirmation | Anticipation = inconsistency | Wait for candle and volume confirmation |
| Overreacting to short-term shifts | Losing long-term bias | Always check higher timeframe trend |
Discipline in trend trading means letting the market confirm direction — not predicting when it will change.
3.9 How SkyAnalyst AI Scores Directional Bias
The AI assigns a Trend Confidence Score based on:
- EMA relationship and slope
- Candle momentum and sequence
- Volume participation
- Multi-timeframe alignment
Each component contributes to a unified bias label:
- Strong Bullish Bias
- Weak Bullish Bias
- Neutral Zone
- Weak Bearish Bias
- Strong Bearish Bias
This helps users instantly understand the underlying direction before evaluating trade setups.
3.10 Key Lessons from Part III
- The trend defines where probabilities favor you
- EMAs create objective structure for identifying direction
- Candle behavior confirms momentum or reveals exhaustion
- Multi-timeframe alignment adds conviction
- SkyAnalyst AI merges EMAs, candles, and momentum data to classify trend confidence automatically
The next part will teach you how to evaluate momentum and confirmation—using MACD, RSI, and slope analysis to validate or reject potential entries.
Part IV – Momentum and Confirmation
4.1 Why Momentum Is the Truth Behind the Move
Trend tells you direction. Momentum tells you strength — and strength reveals truth.
A market can look like it's trending, but if momentum is fading, that move is near exhaustion. Momentum is what separates a short-lived push from a sustainable run.
SkyAnalyst AI measures momentum using:
- MACD for directional acceleration,
- RSI for strength and exhaustion,
- Candle slope and range for real-time conviction,
- Volume confirmation to validate participation.
When these elements align, the system confirms a move as structurally valid — not just visually appealing.
4.2 Understanding Momentum Through Candles
Candles themselves are momentum indicators. Their size, range, and sequence reflect acceleration or slowdown.
| Candle Pattern | Momentum Signal | Interpretation |
|---|---|---|
| Large full-bodied candles (Marubozu) | Strong momentum | Buyers/sellers in full control |
| Shrinking body size after long run | Decelerating momentum | Trend may be weakening |
| Long wicks after strong candles | Exhaustion | Absorption or profit-taking |
| Consecutive large candles with volume rise | Confirmation | Institutional participation |
SkyAnalyst AI quantifies these behaviors mathematically, tracking candle range expansion and contraction to measure momentum shifts before indicators confirm them.
4.3 MACD: Measuring Acceleration and Crossovers
The MACD is one of the most reliable tools for identifying the strength and direction of momentum. It compares two moving averages (fast and slow) to show whether buying or selling pressure dominates.
SkyAnalyst AI uses MACD as a numerical signal rather than a visual chart. It reads three components:
- MACD Line vs. Signal Line – crossover indicates shifts in momentum.
- MACD Line vs. Zero Line – shows if momentum is bullish (above zero) or bearish (below zero).
- Histogram Slope – measures acceleration or deceleration in momentum.
| MACD Condition | Meaning | AI Response |
|---|---|---|
| MACD above Signal, both > 0 | Bullish acceleration | Confirms long setups |
| MACD below Signal, both < 0 | Bearish acceleration | Confirms short setups |
| MACD flat near 0 | No momentum | Neutral zone |
| MACD crossing 0 line | Momentum shift | Possible trend transition |
SkyAnalyst AI integrates this logic with candles:
- If a bullish engulfing pattern appears while MACD crosses above zero → confirmation of new upward momentum.
- If MACD weakens while strong candles lose volume → momentum divergence detected.
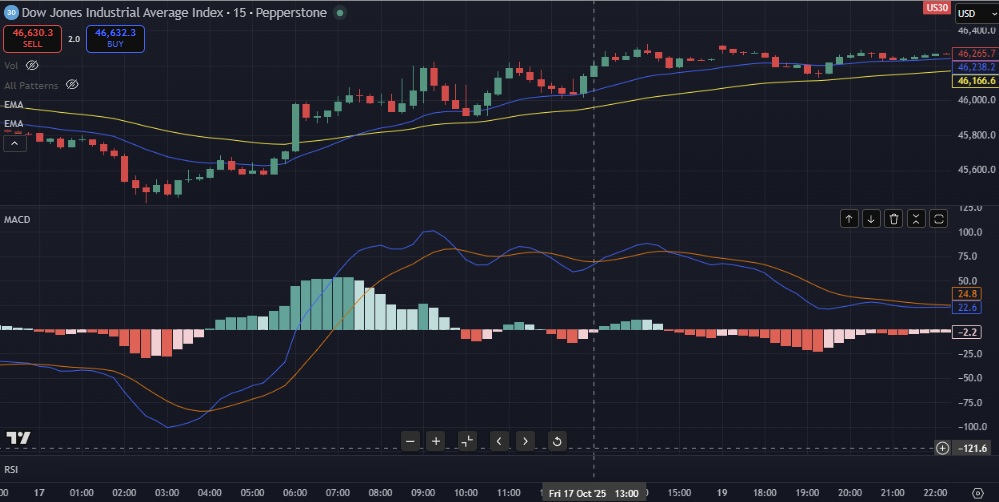
MACD Analysis
The MACD (Moving Average Convergence Divergence) measures the relationship between two exponential moving averages to identify the strength and direction of momentum. In this chart, the blue line represents the MACD line (the difference between the fast and slow EMAs), while the orange line is the signal line, a smoothed average used to confirm momentum shifts. The bars of the histogram visualize the distance between both lines—expanding as momentum strengthens and contracting as it weakens.
When the MACD line crosses above the signal line and both are above zero, it confirms strong bullish momentum, as seen during the upward surge around 07:00–10:00. Conversely, when the MACD crosses below the signal and moves under the zero line, it reflects bearish pressure or fading strength. SkyAnalyst AI interprets these interactions numerically, combining them with EMA trend data to validate whether a move has conviction or if the market is entering a neutral consolidation phase.
4.4 RSI: Strength, Fatigue, and Divergence
The Relative Strength Index (RSI) measures how stretched price movement is. It identifies when trends are overextended and due for correction.
| RSI Reading | Interpretation |
|---|---|
| 70+ | Overbought — trend may pause but not always reverse |
| 30- | Oversold — potential recovery zone |
| 40–60 | Neutral — balanced conditions |
| Divergence (price up, RSI down) | Momentum loss; watch for reversal |
SkyAnalyst AI doesn't use RSI for overbought/oversold alone — it combines it with candle strength and structure.
- A bearish engulfing candle at resistance + RSI divergence = confirmed exhaustion.
- A bullish continuation candle with RSI rising = trend health confirmation.
RSI Momentum Analysis
The Relative Strength Index (RSI) measures the speed and magnitude of price movements to assess momentum and potential exhaustion. In this chart, the purple RSI line represents the classic momentum oscillator, while the yellow line is an EMA (Exponential Moving Average) applied to the RSI itself. Although this yellow RSI EMA is not part of traditional CMT methodology, it provides a valuable visual cue for timing momentum shifts. When the RSI crosses above its EMA, it often signals the beginning of renewed buying strength; when it crosses below, it can mark the start of a potential downturn or loss of momentum.
This smoothed RSI view helps traders identify early turning points with greater clarity—especially when used alongside trend indicators like the 20/50 EMA crossovers. SkyAnalyst AI uses this relationship to detect subtle momentum transitions before they fully appear on price, giving traders a structured and anticipatory edge in their decision-making.
4.5 Volume and Momentum Relationship
Momentum without participation is unreliable. SkyAnalyst AI always pairs momentum readings with volume confirmation.
| Situation | Interpretation |
|---|---|
| Strong candles + high volume | Healthy acceleration |
| Strong candles + low volume | Fake momentum; likely trap |
| Weak candles + rising volume | Counter-pressure forming |
| Exhaustion candles + volume spike | Reversal probability increasing |
This is how SkyAnalyst AI filters out "false strength" — visually large candles that appear powerful but lack true market backing.
4.6 Candle Sequences and Acceleration Phases
SkyAnalyst AI monitors 2–5 candle sequences to understand how momentum develops:
- Acceleration phase: candles grow larger, closes move in one direction, volume expands.
- Deceleration phase: candles shrink, wicks appear, RSI flattens, volume thins.
- Transition phase: doji or engulfing bars at structural zones signal control shift.
Example:
Bullish engulfing → confirmation candle → smaller indecision candle → volume drop. → Momentum is fading; AI marks "trend weakening."
By reading these micro-phases, SkyAnalyst AI identifies transitions before the average trader notices.
4.7 Multi-Layer Confirmation Logic
Momentum confirmation in SkyAnalyst AI requires three layers:
- Structure: price at a logical area (support, resistance, or Fibonacci).
- Indicator alignment: MACD and RSI support the move.
- Candle + volume confirmation: strength visually verified.
Only when all three agree does the AI issue a high-confidence momentum confirmation.
| Layer | Confirmed? | Confidence Level |
|---|---|---|
| Structure only | No | Observation |
| Structure + Indicators | Partial | Caution |
| Structure + Indicators + Candles/Volume | Full | Confirmed |
4.8 Recognizing Momentum Exhaustion
Momentum exhaustion doesn't always mean reversal — it often means pause. SkyAnalyst AI looks for these clues to reduce risk before weakness turns into loss:
- MACD histogram shrinking after extended run.
- RSI divergence near key zones.
- Consecutive small-bodied candles (indecision).
- Volume drop after breakout.
When these appear together, the AI automatically tags the area as a momentum fade zone — reducing its signal frequency until confirmation returns.
4.9 How Momentum Shapes Trade Quality
Momentum defines not just direction, but timing.
- Early momentum → opportunity phase.
- Mature momentum → continuation phase.
- Fading momentum → late-phase risk.
Professionals enter during early or continuation phases; retail traders often chase the late phase.
SkyAnalyst AI helps reverse that behavior — it recognizes acceleration early and flags deceleration before traders get trapped.
EMA Slope and Momentum Sync
The slope of the EMAs (20 and 50) provides another layer of momentum context. If both EMAs are angled strongly in the same direction, it reinforces the MACD and RSI readings.
Example:
- MACD and RSI both bullish → EMAs rising → trend and momentum in sync.
- MACD bullish but EMAs flat → early trend, needs confirmation.
- MACD bullish, RSI diverging, EMAs flattening → momentum loss; potential reversal zone.
This multi-layer approach prevents premature entries and helps define quality trades over frequent trades.
Combining Trend and Momentum
Momentum is the confirmation layer for trend. SkyAnalyst AI follows a hierarchy of logic:
- Trend: Identify direction using EMAs.
- Momentum: Confirm direction using MACD and RSI.
- Structure: Validate setup using support, resistance, and Fibonacci zones.
- Volume: Confirm participation (covered next part).
When all layers agree, probability increases dramatically. This is what SkyAnalyst AI refers to as confluence alignment.
How to Read Momentum Shifts
Momentum shifts are like warning lights before reversals. They don't mean "enter now"—they mean "prepare for change."
Signs of a potential shift:
- MACD histogram shrinking while price still rises or falls.
- RSI moving back toward 50 after extreme readings.
- EMAs flattening or crossing after a long move.
When these signs appear, SkyAnalyst AI marks the market as caution zone and reduces trade frequency until direction reconfirms.
Practical Application for Traders
When you read SkyAnalyst AI's analysis or signals, keep this sequence in mind:
- If the AI marks trend and momentum both bullish → trade continuation setups.
- If trend is bullish but momentum turns neutral → tighten risk or wait.
- If both turn bearish → shift focus to short setups.
Following this structure keeps your trading systematic and reduces emotional bias.
4.10 Key Lessons from Part IV
- Momentum reveals conviction and sustainability of price movement.
- Candle size and sequence reflect acceleration or exhaustion in real time.
- MACD and RSI confirm strength or warn of divergence.
- Volume distinguishes real moves from fake ones.
- SkyAnalyst AI combines these layers to confirm trend strength and detect exhaustion before reversals form.
The next part will explain Volume and Participation — how to validate every move through market activity, and how SkyAnalyst AI reads institutional presence and exhaustion directly from volume dynamics.
Part V – Volume and Participation
5.1 Why Volume Is the Final Confirmation
Price shows intention. Volume shows participation.
A move without participation is like a speech with no audience — it may sound convincing, but no one is acting on it.
Volume tells you who is behind a move:
- When large traders participate → trends extend.
- When volume dries up → trends stall or reverse.
SkyAnalyst AI treats volume as the final validation layer before confirming any entry signal.
5.2 How SkyAnalyst AI Reads Volume
The system compares real-time volume to its Volume SMA (Simple Moving Average) baseline. This allows the AI to determine if current participation is normal, rising, or fading.
| Condition | Meaning | AI Behavior |
|---|---|---|
| Volume > SMA | Increased participation | Confirms strength of move |
| Volume ≈ SMA | Normal flow | Neutral confirmation |
| Volume < SMA | Low participation | Weak move; reduced signal confidence |
Volume doesn't predict direction — it validates conviction. SkyAnalyst AI uses it to strengthen or weaken candle-based and momentum-based signals.
Volume Analysis
This chart highlights how SkyAnalyst AI interprets volume to confirm or question the strength of a market move. Each bar represents trading volume, while the blue line overlaying it is the Volume Simple Moving Average (SMA)—a baseline that measures typical participation levels for this timeframe. When volume bars rise above the SMA, it indicates increased market participation, confirming momentum and strengthening trend confidence. In contrast, when volume stays below the SMA, it suggests weak participation or potential false breakouts, warning traders that the move may lack conviction.
By comparing volume against its average, SkyAnalyst AI identifies whether a move is supported by real institutional activity or driven by short-term noise. When combined with structure, trend, and momentum data, this dynamic volume analysis becomes a key filter for evaluating entry quality and trade validity.
5.3 Volume Behavior During Market Phases
Volume interacts with structure differently depending on market phase:
| Market Phase | Volume Behavior | Interpretation |
|---|---|---|
| Accumulation | Low and stable | Institutions entering quietly |
| Advancing Trend | Rising volume | Broad participation confirms trend |
| Distribution | Flat or declining | Buying power fading |
| Decline | Rising again | Panic selling or forced liquidation |
SkyAnalyst AI detects these transitions and adjusts probability weighting accordingly. A sudden surge in volume near the end of a long trend often marks capitulation — the emotional climax before reversal.
5.4 Volume and Candle Interaction
Candles show what price did. Volume shows how many traders made it happen.
| Candle Behavior | Volume Reaction | Interpretation |
|---|---|---|
| Large candle + high volume | True conviction | Valid continuation |
| Large candle + low volume | False strength | Potential trap |
| Small candle + high volume | Hidden absorption | Smart money entering or exiting |
| Exhaustion wick + high volume | Reversal potential | Emotionally driven climax |
SkyAnalyst AI combines these readings with structure. For example:
- A bullish engulfing at support with rising volume → valid reversal.
- A hammer with low volume → visual pattern, no real participation → ignore.
This prevents traders from acting on empty moves.
5.5 Volume Spikes and Breakouts
Breakouts only matter when volume confirms them. SkyAnalyst AI detects volume spikes that exceed the rolling average by a defined ratio.
| Signal | Volume Confirmation | Meaning |
|---|---|---|
| Breakout + High Volume | Valid move | Real expansion |
| Breakout + Low Volume | False break | Trap likely |
| Retest + Sustained Volume | Confirmation | Trend continuation |
The AI highlights these events as validated breakouts when structure, candles, and momentum agree. Without that alignment, a spike is treated as a one-off anomaly.
Professional rule: Price moves can lie. Volume tells the truth.
Volume Spike & Breakout
This chart illustrates a classic volume spike and breakout scenario around 14:45, where participation suddenly surged, signaling an important shift in market behavior. The large volume bar stands out sharply from the previous average, marking a point where institutional activity or news-driven reactions likely entered the market. The price initially accelerated upward but then quickly reversed, showing how volume spikes can also reveal liquidity sweeps or false breakouts before the real move develops.
SkyAnalyst AI interprets such spikes by quantifying how much they exceed the recent volume average. A breakout on strong volume confirms genuine participation and often precedes continuation, while a spike without follow-through—as seen here—signals possible exhaustion or exit from large players. This reinforces the professional rule: "Price can deceive, but volume tells the truth."
5.6 Volume During Trends
Volume behaves differently depending on market phase:
| Trend Phase | Volume Behavior | Meaning |
|---|---|---|
| Early Uptrend | Rising volume | Institutional accumulation. |
| Mid-Trend | Stable or slightly declining volume | Healthy continuation. |
| Late Trend | Sharp spikes followed by drop | Exhaustion warning. |
| Range | Low volume | Market indecision. |
SkyAnalyst AI monitors these changes to classify trend strength and probability of continuation.
5.7 Volume Divergence
A volume divergence occurs when price and volume disagree:
- Price makes new highs, but volume does not → weak breakout.
- Price makes new lows, but volume shrinks → sellers losing control.
These divergences help the AI detect fading momentum before it becomes visible on indicators. This layer is part of its predictive caution mechanism.
Volume Divergence
This chart shows a classic example of volume divergence signaling a potential reversal. At first, price climbs steadily, supported by strong volume—indicating solid buying participation and momentum. However, as the rally continues, each new high is accompanied by lower volume bars, meaning fewer buyers are sustaining the move. This pattern reflects buyer exhaustion—the market is still rising in price, but participation is drying up. Eventually, once volume fades significantly, the price structure loses strength and begins to reverse, confirming that the prior uptrend had run out of energy.
SkyAnalyst AI detects these shifts automatically. When it identifies price rising while volume falls, it interprets the behavior as weakening trend conviction, increasing the probability of a near-term reversal—especially when aligned with nearby Fibonacci retracement or resistance zones.
5.8 Volume and Momentum Integration
Volume and momentum work together like power and speed.
Momentum = speed of price Volume = force behind it
A fast move (strong candles, MACD acceleration) with weak volume = lightweight move. A moderate move with high volume = heavy conviction.
SkyAnalyst AI multiplies these dimensions in its internal model:
- Strong candle + MACD confirmation + above-average volume = "high-quality impulse."
- Same setup with low volume = "low-quality impulse."
5.9 Identifying Exhaustion Volume
Exhaustion happens when both volume and candle range expand dramatically after a long move. It's the last burst of energy before collapse.
Clues:
- Largest candle of the trend appears.
- Volume spikes 2–3x above average.
- Follow-up candle closes opposite direction.
SkyAnalyst AI automatically flags this sequence as potential reversal exhaustion, warning users to tighten risk or stand aside.
5.10 Smart Volume Behavior at Key Zones
Institutions buy quietly and sell loudly. Volume helps reveal where the big players act.
| Zone | Volume Signature | Interpretation |
|---|---|---|
| Support with rising volume | Demand stepping in | Accumulation |
| Resistance with rising volume | Supply defending level | Distribution |
| Breakout with sustained volume | Institutional confirmation | Trend expansion |
| Breakout with fading volume | Retail chase, weak move | Probable trap |
SkyAnalyst AI tracks this across timeframes, so a trader sees whether a move has real backing or just noise.
5.11 How SkyAnalyst AI Scores Volume Confirmation
Volume contributes directly to the AI's Signal Confidence Model, alongside structure, trend, and momentum.
Each setup is scored numerically:
- Structure alignment (location accuracy)
- Candle conviction (body and sequence)
- Momentum health (MACD/RSI sync)
- Volume confirmation (participation strength)
A setup with strong volume support gets a higher probability tag and is prioritized in the AI feed.
5.12 Key Lessons from Part V
- Volume measures participation, not prediction.
- Strong moves require strong volume to be valid.
- SkyAnalyst AI compares current volume to its average to confirm move quality.
- Divergence between price and volume warns of weakening trends.
- Volume spikes confirm breakouts or signal exhaustion.
- Volume and momentum together reveal "high-quality" vs "low-quality" impulses.
- Institutions leave volume signatures at key zones—AI tracks these across timeframes.
- SkyAnalyst AI integrates volume behavior with candle, structure, and momentum to validate every signal's credibility.
The next part will teach you how to combine all technical layers—structure, trend, momentum, and volume—into actionable confluence zones that SkyAnalyst AI uses to generate entry and exit signals.
Part VI – Confluence and Execution Zones
6.1 What Confluence Really Means
Confluence means confirmation. It's when multiple forms of evidence—structure, candle behavior, trend, momentum, and volume—all agree on the same idea.
The more layers that agree, the higher the probability of success.
SkyAnalyst AI's core design revolves around this principle: it doesn't rely on one indicator—it synthesizes alignment across several dimensions.
When a structural level, candle sequence, and momentum confirmation align with trend and volume, the AI identifies that zone as a high-probability execution area.
6.2 The Five Layers of Confluence
SkyAnalyst AI evaluates five interconnected layers before confirming any setup:
| Layer | Description | Purpose |
|---|---|---|
| Structure | Key support, resistance, or Fibonacci zones | Defines where the opportunity may exist |
| Candles | Price behavior and patterns | Defines when the opportunity appears |
| Trend | EMA alignment (20/50) | Confirms directional bias |
| Momentum | MACD, RSI, candle acceleration | Confirms strength and sustainability |
| Volume | Participation validation | Confirms conviction and reliability |
When all five align, the signal is not emotional—it's systematic.
6.3 How Confluence Builds Probability
Think of each layer as a filter:
- Structure filters location.
- Trend filters direction.
- Candles filter timing.
- Momentum filters strength.
- Volume filters conviction.
A trade with one filter = speculation. A trade with all five filters = logic.
SkyAnalyst AI measures this alignment mathematically. The more filters confirmed, the higher the Signal Confidence Score (SCS), which categorizes setups as:
| Confidence Level | Description |
|---|---|
| High Confluence | 4–5 layers confirmed → strong signal |
| Moderate Confluence | 2–3 layers confirmed → watchlist setup |
| Low Confluence | 0–1 layer confirmed → ignore / noise |
6.4 Anatomy of an Execution Zone
An execution zone is not a single price point—it's a region where conditions converge. SkyAnalyst AI highlights these zones visually and textually in its analysis output.
Example of a bullish execution zone:
- Price retraces to 50% Fibonacci level at structural support.
- Bullish engulfing candle forms with volume above average.
- 20 EMA above 50 EMA → uptrend intact.
- MACD crosses above zero → acceleration confirmed.
Result: Execution Zone = "Bullish Continuation Area"
SkyAnalyst AI marks it with defined entry, stop, and target zones.
6.5 Entry Triggers and Confirmation Candles
Candles act as the final trigger within a confluence zone.
| Pattern | Context | Meaning |
|---|---|---|
| Bullish engulfing at support | After pullback in uptrend | Entry trigger |
| Shooting star at resistance | End of rally | Reversal trigger |
| Breakout candle with volume surge | Through resistance | Continuation entry |
| Doji at midpoint of range | No structure context | Ignore signal |
SkyAnalyst AI waits for a confirmation candle—one that closes in the direction of the intended move with momentum and volume support. Only then does the signal become actionable.
6.6 Stop-Loss and Risk Logic Inside the Zone
Even with strong confluence, risk control defines professionalism. SkyAnalyst AI integrates dynamic risk management directly into its execution logic.
Typical rule structure:
- Stop-Loss: placed beyond invalidation point (outside structure or candle wick).
- Risk Per Trade: approximately 1% of capital or according to user-defined dynamic risk model.
- Position Scaling: optional; increase or reduce size based on recent performance metrics.
If price action invalidates the confluence (for example, structure break with high-volume opposite candle), the AI marks the signal as "invalidated"—no action recommended.
6.7 Example: Full Confluence Setup
Scenario: Bullish Continuation
| Layer | Evidence |
|---|---|
| Structure | Price pulling back into 50% Fibonacci zone |
| Candles | Bullish hammer followed by engulfing |
| Trend | 20 EMA > 50 EMA (uptrend intact) |
| Momentum | MACD rising, RSI crossing 60 |
| Volume | Above average, confirming demand |
AI Output:
"High-Confluence Zone detected. Entry Trigger: Close above 20 EMA. Stop: Below recent swing low. Confidence: 87% (Strong)."
This systematic output ensures the trader acts with structure, not emotion.
Confluence in Trend Continuation
During strong trends, the highest-probability trades come from pullbacks into confluence areas. Example of continuation logic in an uptrend:
- Price pulls back to the 38.2%–50% Fibonacci zone.
- Bullish candle pattern forms at the level.
- 20 EMA remains above 50 EMA (trend intact).
- MACD turns up from zero.
- Volume rises.
This alignment of all five layers signals that the market is refueling for the next move. SkyAnalyst AI detects and highlights these setups as continuation zones.
Confluence in Reversal Scenarios
Reversals require more evidence than continuations. The AI looks for early structural and momentum warning signs before labeling a reversal zone.
Example:
- Downtrend weakens; EMAs flatten.
- RSI forms bullish divergence.
- MACD histogram crosses above zero.
- Volume spike confirms participation.
When three or more layers align, SkyAnalyst AI marks a reversal watch zone. This doesn't mean "enter now"—it means prepare for change.
6.8 Multi-Timeframe Confluence
High-quality signals appear consistently across multiple timeframes.
| Higher Timeframe (HTF) | Lower Timeframe (LTF) | Confluence Level | Action |
|---|---|---|---|
| HTF bullish | LTF bullish | Highest | Ideal continuation entry |
| HTF neutral | LTF bullish | Medium | Possible short-term play |
| HTF bearish | LTF bullish | Low | Countertrend; avoid |
SkyAnalyst AI cross-verifies setups between timeframes automatically, prioritizing trades that align across both perspectives.
6.9 Emotional Clarity Through Confluence
Trading without confluence feels uncertain. With confluence, emotion is replaced by logic. Each layer removes doubt and builds conviction.
Professionals don't guess—they align. SkyAnalyst AI replicates that discipline, giving traders confidence backed by measurable data.
6.10 Key Lessons from Part VI
- Confluence is confirmation—multiple factors agreeing at once.
- Structure defines where, candles define when, trend defines direction, momentum defines strength, and volume defines conviction.
- SkyAnalyst AI quantifies all five layers to identify high-probability execution zones.
- Confirmation candles trigger entries; invalidation candles protect you.
- Dynamic risk management ensures survival even when confluence fails.
- Confluence brings emotional stability—logic replaces fear.
6.11 Bringing It All Together
You've now seen how all layers connect:
- Structure—the map.
- Price Action—the language.
- Trend—the compass.
- Momentum—the engine.
- Volume—the validation.
- Confluence—the final decision logic.
This is how SkyAnalyst AI thinks—not in isolation, but through integration. It combines professional analysis discipline with the objectivity of AI, helping traders execute with precision, confidence, and control.
End of Section 4 – Technical Analysis
You now understand how SkyAnalyst AI interprets the market like a professional analyst, layering context, direction, strength, and participation into a unified model for structured decision-making.